NFHS-4: An analysis of district level malnutrition data for Odisha

NFHS – 4 provides, for the first time a district level data on nutritional status of children below the age of 5 years. This provides an excellent and timely opportunity to plan for eradication of child malnutrition at the district level. A quick preliminary analysis of the district level child malnutrition levels, reveals certain important aspects. This is presented below.

Table -1 below presents the data on wasting, underweight and stunting in a colour coded form. These three aspects of child malnutrition are interrelated. This relationship is brought out in Figure 1a.  There is a clear linear relationship between underweight on one hand and stunting and wasting on the other. The very robust nature of both the linear regressions (R Sq of 0.88 for stunting and 0.76 for wasting), has a bearing on programme implemention. Collecting good quality data on underweight can give us a good indication of the levels of wasting and stunting as well. Hence we need not initiate routine measurement of height through Anganwadi workers or ASHAs. The task of estimating stunting can be left to periodical NFHS surveys which will now be taking place at 3 year intervals[1]. At Anganwadi level recording weight and use of MUAC tapes to identify wasting will be adequate at this stage.

[1] Measurement of height or length (child below 2 years) is not an easy task and is error prone if done by workers not adequately skilled and experienced. As such burdening the Anganwadi workers with this task is best avoided. 

Table 1: Nutritional status of children under age of 5 in terms of % Stunted, %Wasted, %Severely Wasted and % Underweight in NFHS-3 survey and NFHS-4 survey in rural population of Odisha, in color coded form based on their relative performance (Red, Yellow and Green represents worst, moderate and good performing district.)
Figure 1a shows correlation between % Underweight and %Stunted / % Wasted
Figure 1b shows correlation between %Wasted and %Severely Wasted.

It is useful to rearrange Table – 1 in descending order of underweight. This brings out the low levels of severe wasting in coastal belt. Districts which have low figures of severe wasting have mostly got other parameters right, and, more importantly, where this has gone wrong, other parameters have gone wrong too.

Table -2, quite clearly, brings out the importance of reducing the incidence of severe wasting. It also shows the regional contiguity of the parameters and the need for separate planning for different districts.

Table 2: Identification of best performing districts on the basis of % Underweight

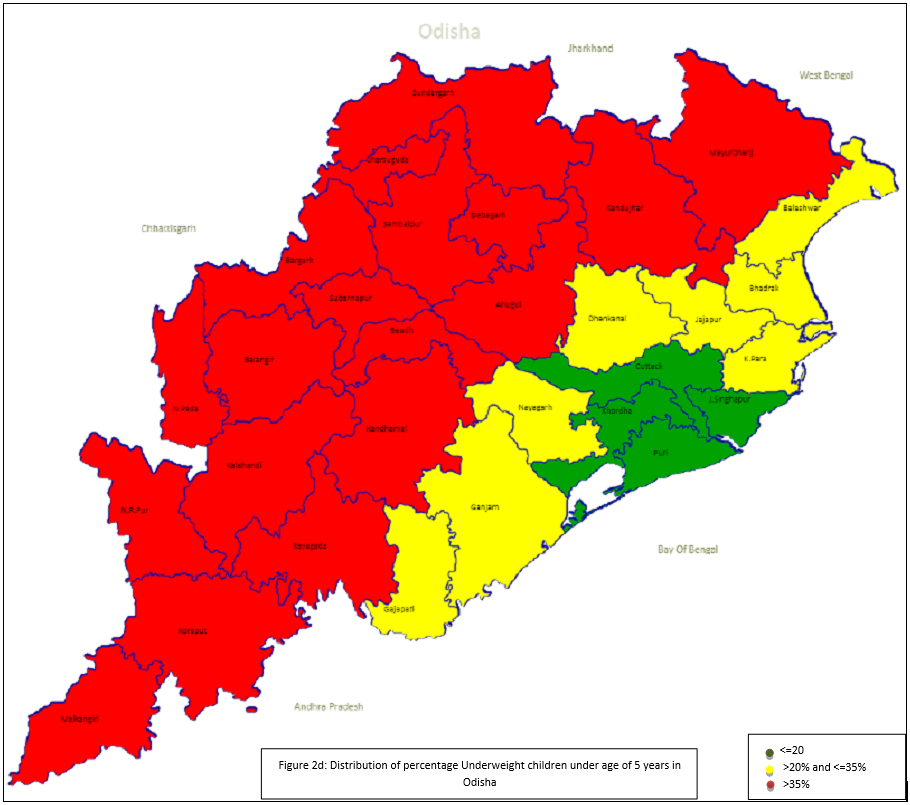
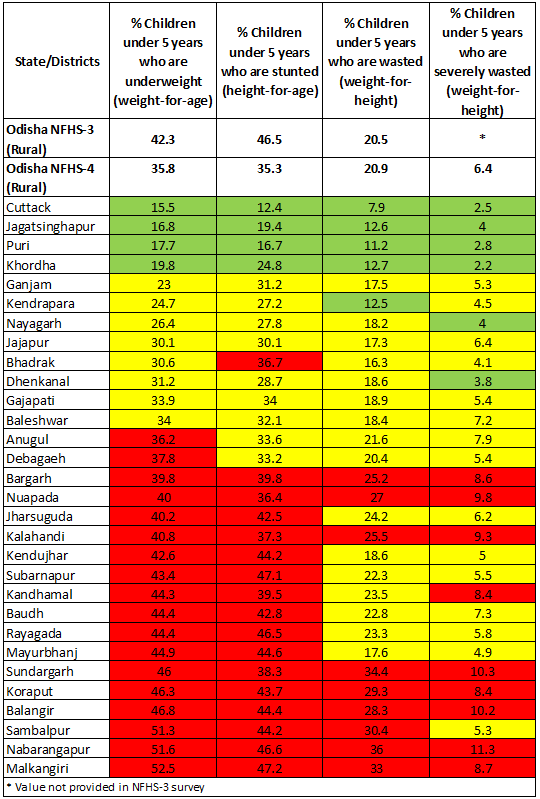
The coastal districts of Jagatsinghpur, Cuttack, Kendrapada, Puri and Khordha have done well in all parameters. While Ganjam shows better result in underweight, it needs to improve on rest of the parameters. The case of Nayagarh is interesting, a modest reduction in underweight and stunting (not colour coded purposefully) would have put it in the league of the other coastal districts. Baleshwar and Jajpur are somewhat of a surprise and may need a closer scrutiny.

The Angul, Jharsuguda, Debgarh belt has intermediate position along with Gajpati, which shows a low incidence of wasting. Whether this is consistent or a one off case needs to be seen.

On the other end of the spectrum, districts of Southern and some of the districts in Western Odisha have not fared well. Mayurbhanj and Keonjhar two contiguous tribal districts have done relatively better in reducing wasting, but not other parameters.

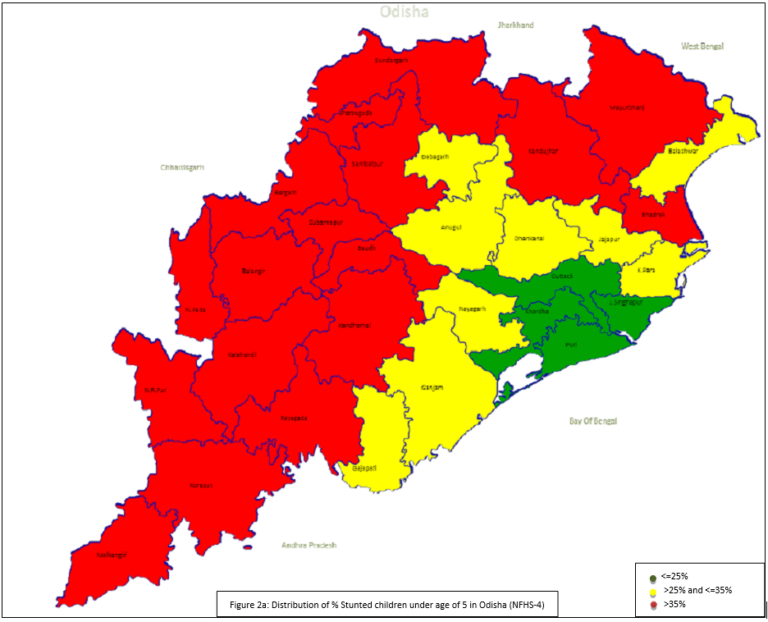
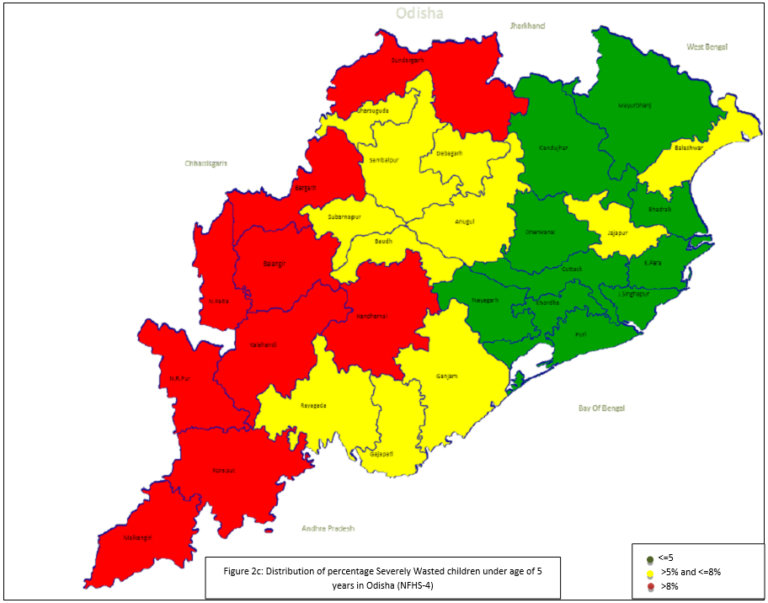
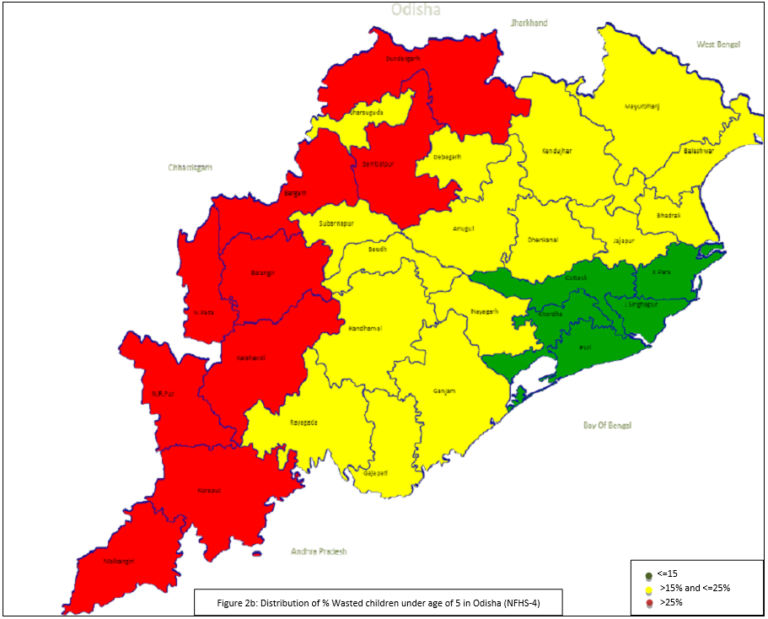
The regional dimension of the situation can be readily appreciated if we look at the Odisha map as brought in Figure 2a-2d below. The maps clearly show three separate clusters in green, yellow and red corresponding to the least, middle level and high malnutrition.

Figure 2a
Figure 2c
Figure 2b
Figure 2d

Figure 2: Map of Odisha (Rural Population) showing distribution of a) % Stunted, b) %Wasted, c) %Severely Wasted and d)% Underweight children under age of 5 as reported NFHS-4 survey

There is a very clear case for taking Dhenkanal, Nayagarh, Gajapati and Ganjam belt from the yellow zone to the green zone. So is the case with the Jajpur – Bhadrak – Balasore zone.

One area of focus would be the Jagatsinghpur, Kendrapada and Cuttack belt which is ‘closest to the goal-post’ of removing moderate and severe malnutrition. It may be a useful idea to monitor all the severely wasted and underweight children on an intensive basis and take remedial measures.

This preliminary analysis is useful in indicating where does the shoe pinch the most. A more detailed analysis needs to be done by looking at other parameters under NFHS-4 i.e. the correlates of child malnutrition. This is presented in the next stage of the analysis where we look at the districts with the best potential to achieve the status of being “malnutrition free”.

These observations were made by Prof. Satish B Agnihotri and Ayushi Jain.

Leave a Reply