Birth seasonality trends across India

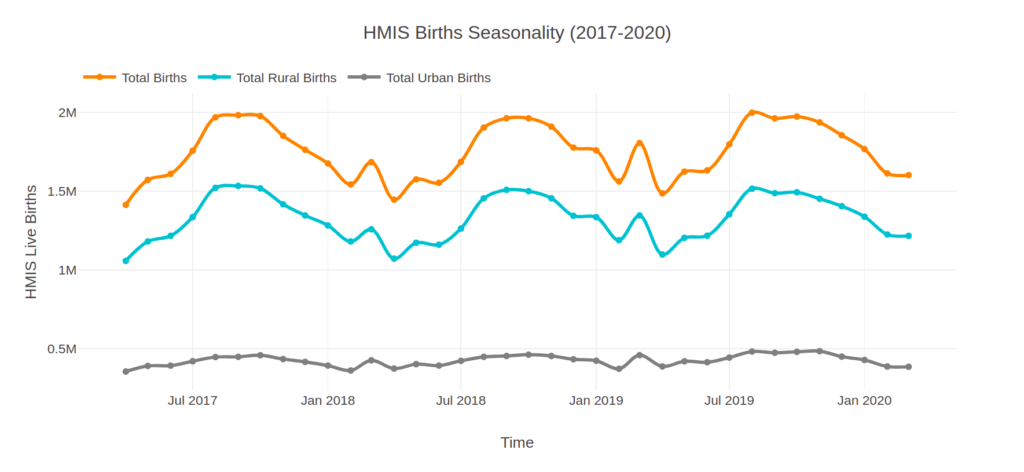
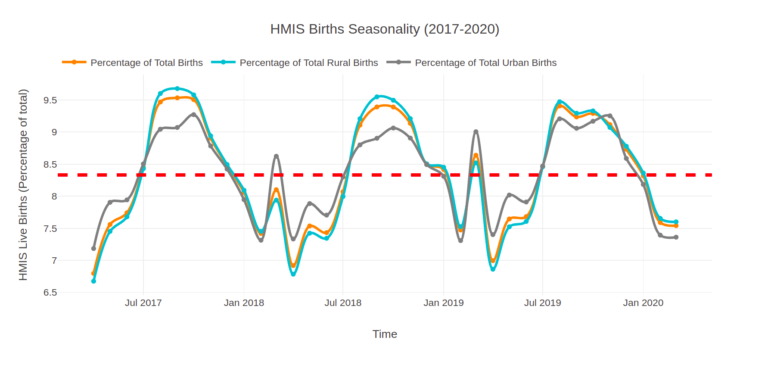
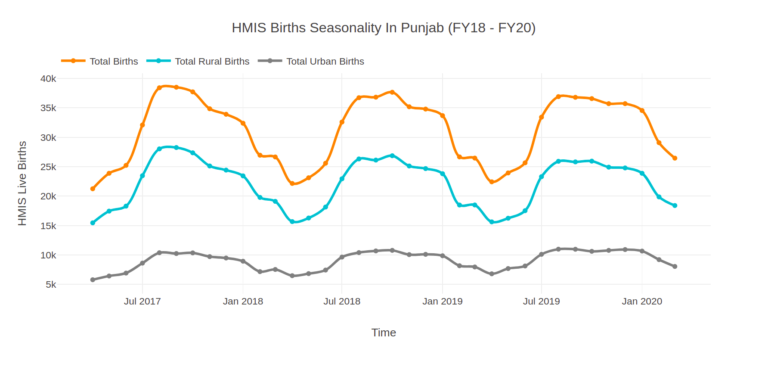
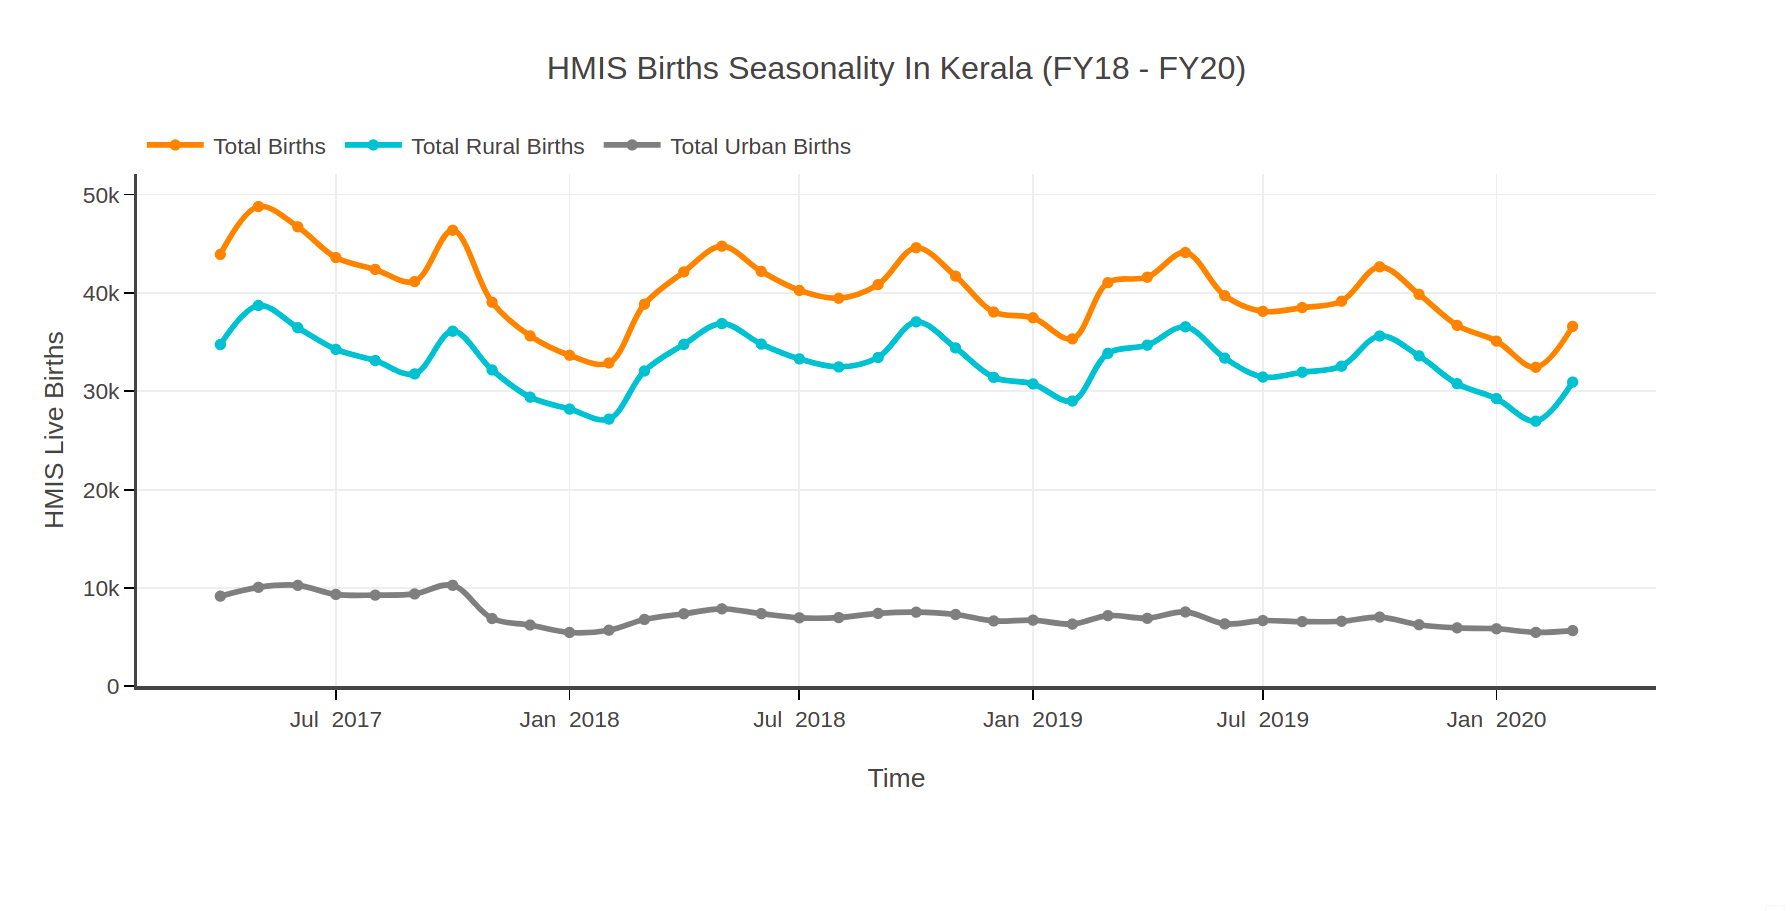
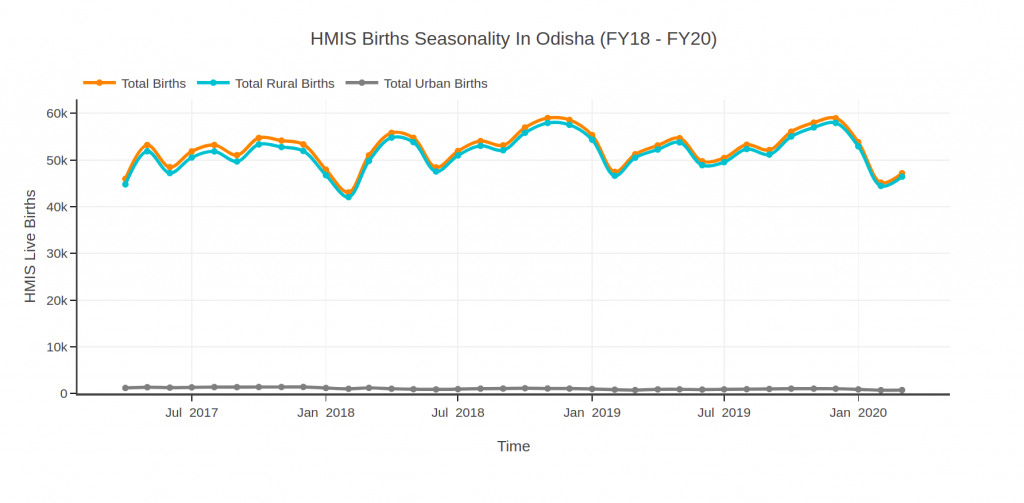
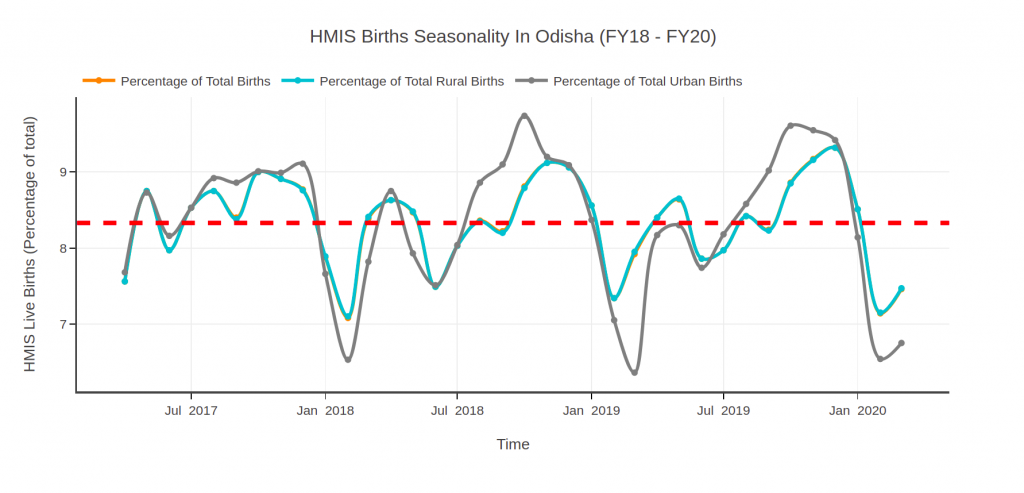
In this weekly series we present birth seasonality trends across India, as revealed by the Health Management Information System (HMIS) data released by Ministry of Health and Family Welfare. We examine the monthly trends in data, between FY18-FY20. The data has been tested for its consistency across three years and the data is found to be reasonably consistent across states, and for rural and urban areas as well.

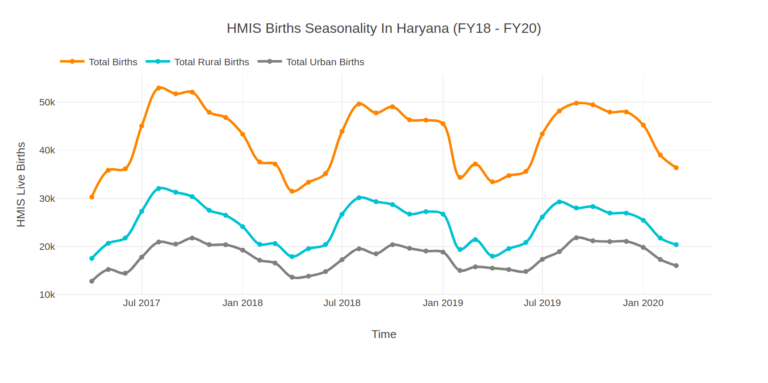
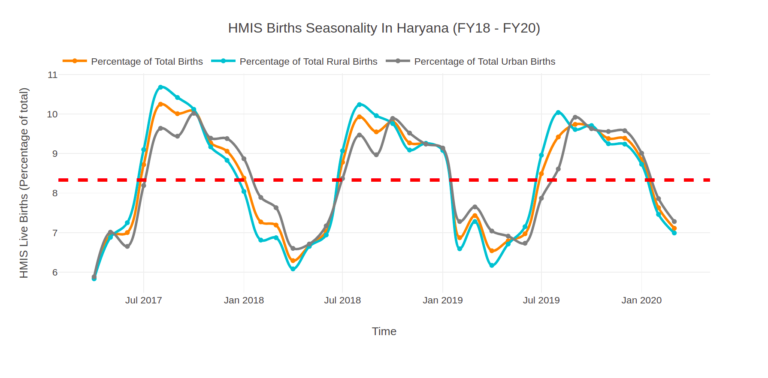
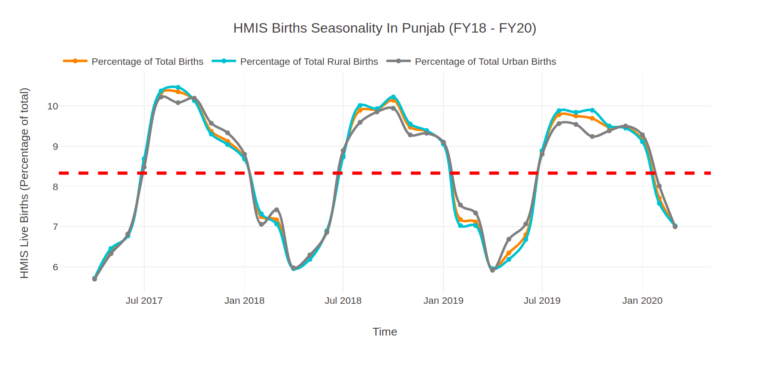
The trends revealed at the all-India level, as expected, mask considerable inter-state differences. We present results of different state groups based on the similarities in their trends.

The immediate implications of these findings are the pivoting of family planning program in accordance with the patterns observed. The months which see higher number of births also necessitate greater preparedness of the physical infrastructure for the higher case load and ensuring adequate supply of immunisation and other child care services.

The three-year trend in live births at the all-India level reveal that births consistently rise above the mean in time period of July-December and then fall below it right after (See Figure 2).

Figure 1. Seasonal Trends in Live Births in India (in Absolute terms) Source: HMIS (FY18 - FY20)
Figure 2. Seasonal Trends in Live Births in India (Deviation from Mean) Source: HMIS (FY18 - FY20)

With respect to states of Punjab and Haryana, we see the peak of births during August and September and a consistent dip in the months of February and March. This pattern is visible in plains of agrarian states (Figure 3 to Figure 6). 

Figure 3. Seasonal Trends in Live Births in Haryana (in Absolute terms) Source: HMIS (FY18 - FY20)
Figure 4. Seasonal Trends in Live Births in Haryana (Deviation from Mean) Source: HMIS (FY18 - FY20)
Figure 5. Seasonal Trends in Live Births in Punjab (in Absolute terms) Source: HMIS (FY18 - FY20)
Figure 6. Seasonal Trends in Live Births in Punjab (Deviation from Mean) Source: HMIS (FY18 - FY20)

In contrast  to agrarian states, Kerala and Odisha do not show any consistent seasonality for urban areas. The curve plotted in absolute terms remains flat throughout the year. The births in the rural areas are driving the state-level trends for both the states. Both states consistently witness a steep dip during months of January and February. With respect to peaks, while Odisha reports peaks in October-December, Kerala reports peak in months of May and October -November across the years.

Figure 7. Seasonal Trends in Live Births in Kerala (in Absolute terms) Source: HMIS (FY18-FY20)
Figure 8. Seasonal Trends in Live Births in Odisha (in Absolute terms) Source: HMIS (FY18-FY20)
Figure 9. Seasonal Trends in Live Births in Kerala in terms of percentage of percentage of total births in a year (Deviation from Mean) Source: HMIS (FY18-20)
Figure 10. Seasonal Trends in Live Births in Odisha in terms of percentage of total birth in a year (Deviation from Mean) Source: HMIS (FY18-20)

Disclaimer

The images uploaded on this website, if found reproduced elsewhere, without appropriate acknowledgement and citation are liable for legal action.

Please use this citation for reproducing these images elsewhere:

Nambiar et al (Forthcoming) – “Seasonal variations in births in India”

Leave a Reply