
Introduction:
The National Family Health Survey (NFHS) is an important source of information on the periodic progress made on several key health indicators. Among other things, the survey tracks nutritional status of mother and child and the quality of antenatal and post-natal services at the state and district level. Recently, the NFHS 5 data (Phase-1) was released for select states and their districts facilitating for the first time a panel data analysis at the district level. The current report compares data of NFHS 4 (2015-16) to NFHS 5 (2019-20) data to examine progress on several select key indicators in the 36 districts of Maharashtra. The focus is on the indicators that impact nutritional outcomes—immediate and underlying factors as well as key health coverage indicators.
Key Findings:
Significant reduction in stunting is seen in Akola, Amravati and Yavatmal. With respect to underweight it is seen in Osmanabad, Akola, Gadchiroli and Yavatmal, while in wasting it is seen in Gadchiroli, Nandurbar and Raigarh. In overall terms for child nutritional status, districts that have performed uniformly well are; Yavatmal, Osmanabad, Gadchiroli and to an extent Jalna and Nandurbar.
Findings:
We first present the data on the outcome parameters, wasting, underweight and stunting for children under age years at the district level (Table-1) in a colour-coded form for ready appreciation of the combined performance of a given district.
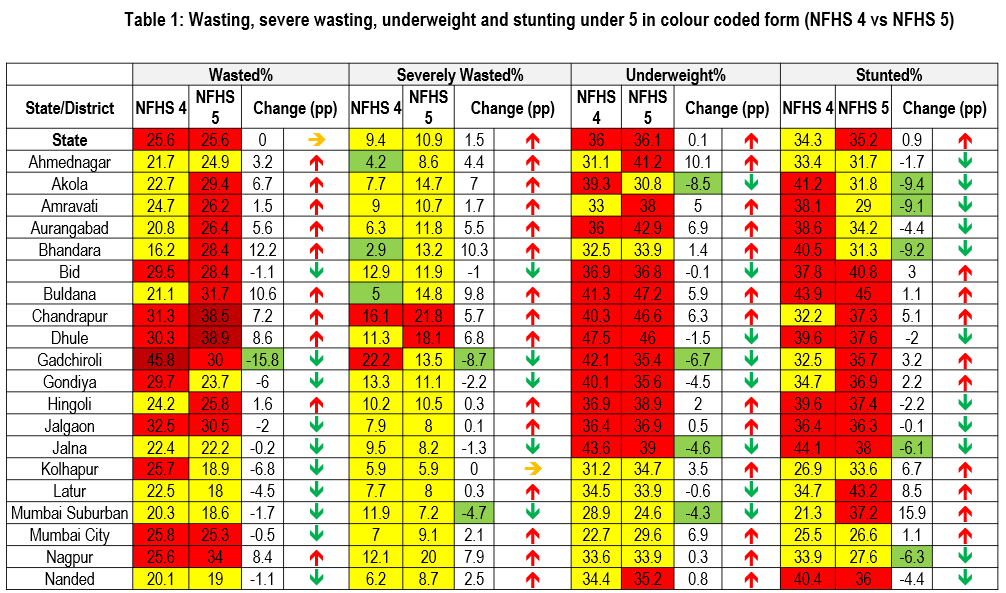
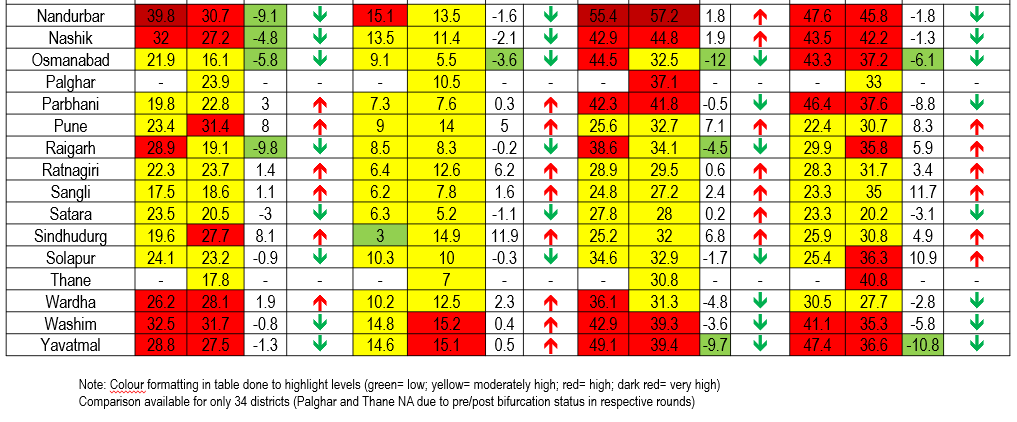
As noted in Table 1 (a), between the two survey periods, the most significant decline was observed in terms of prevalence of stunting – in 19 out of the 34 districts. The most notable decrease were observed in Yavatmal, Akola, Bhandara and Amravati districts. Many districts also saw a decline (from NFHS 4) in their incidence of wasting (18 of the 34 districts). However lesser number of districts in Maharashtra observed reduction in their rates of severe wasting (11 of 34 districts) and underweight prevalence (15 of 34 districts) .
Among the districts, Bhandara reported the highest increase in its rates of wasting, Sindhudurg reported the highest increase in rate of severe wasting whereas Ahmednagar and Mumbai Surburban reported the highest increases in their rates of underweight and stunting prevalence respectively since NFHS 4. Some other trends were observed. At least six districts saw reduction in only stunting whereas their rates of wasting, severe wasting and underweight prevalence increased—Ahmednagar, Amravati, Aurangabad, Bhandara, Hingoli and Nagpur. Also, six districts did not report progress in any of the four nutritional indicators —Buldana, Chandrapur, Pune, Ratnagiri, Sangli and Sindhudurg.
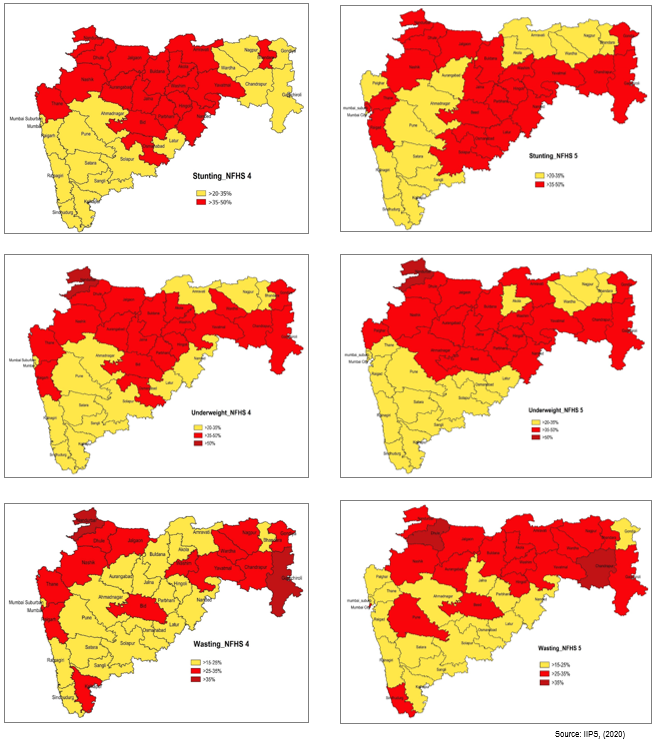
The district-wise data is also depicted on the map (Figure 1). As seen in the maps, the poor performing districts appear to cluster together. The districts located in the northern part of Maharashtra have lagged behind on the nutrition indicators. The most discernible improvement was observed in the terms of reduction in wasting, across two survey periods. Districts with significant ST population like Gadchiroli and Nandurbar reported notable reductions in their figures of wasting.
The maps also present NFHS 4 data with Thane prior to bifurcation and NFHS 5 data of post bifurcated Thane and new Palghar district. While pre-bifurcated Thane had high rates of wasting, underweight and stunting prevalence in NFHS 4, bifurcated Thane reported high rates of stunting and Palghar reported high rates of underweight prevalence in NFHS 5.
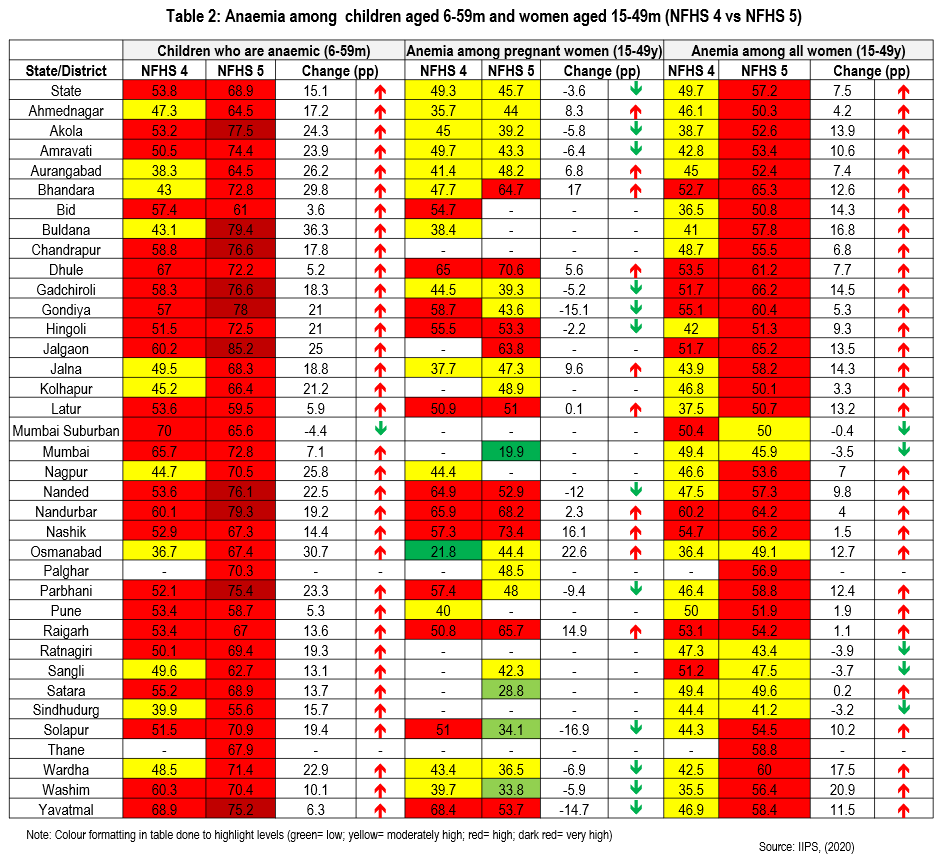
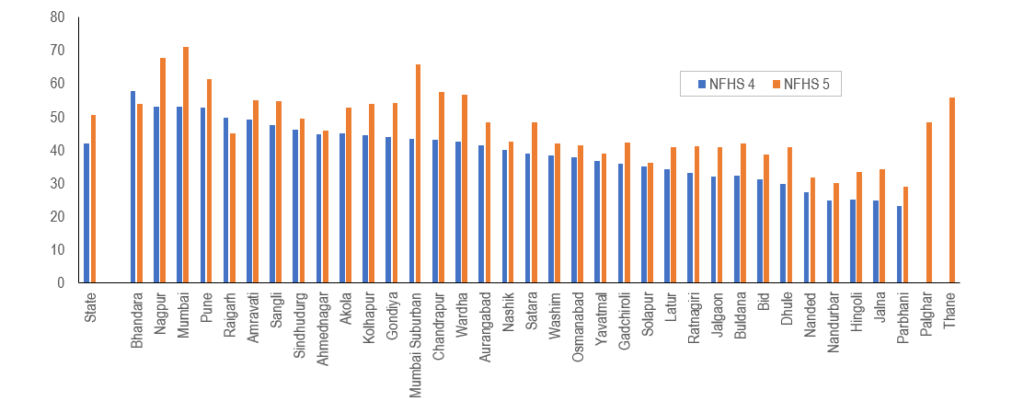
As noted in Table 2, the data on child anaemia (Hb<11.0 g/dl) among children under five demonstrates a worrying trend—only one out of the 34 districts reported a decline in childhood anaemia rates since NFHS 4. In fact, 22 districts reported a significant spike. of about 15 percentage points or more in child anaemia between the rounds. 10 districts reported very high rate (>75% prevalence) of anaemia among children aged below 5 years.
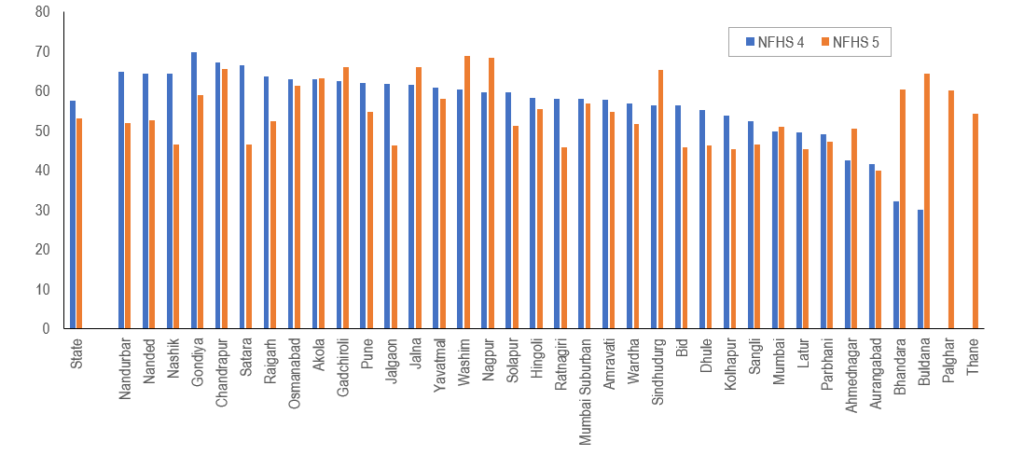
In terms of anaemia among pregnant women, only half of the 21 districts for which data was reported showed some reduction. However Solapur, Gondiya and Yavatmal reported notable reductions. In NFHS 5, the lowest incidence of anaemia among pregnant women was reported by Mumbai city district. In terms of anaemia among women aged 15-49 years, only five districts reported reduction since NFHS 4. Even among these districts, the reduction has been modest, less than five percentage points.
Immediate Determinants
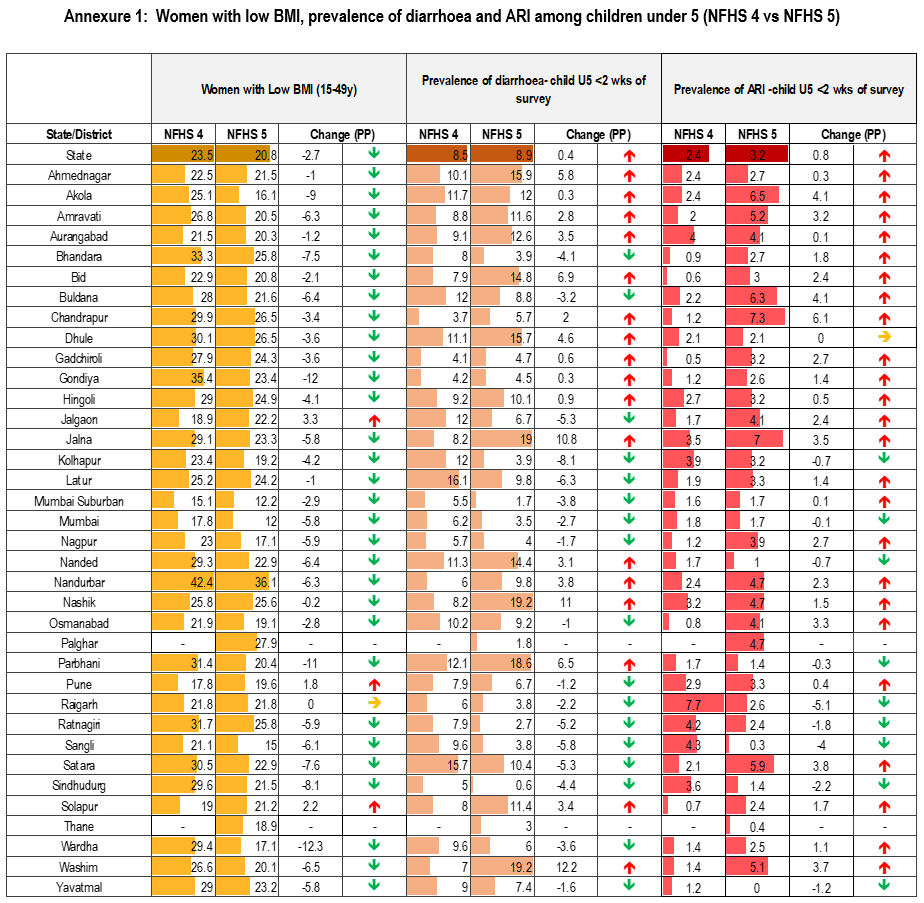
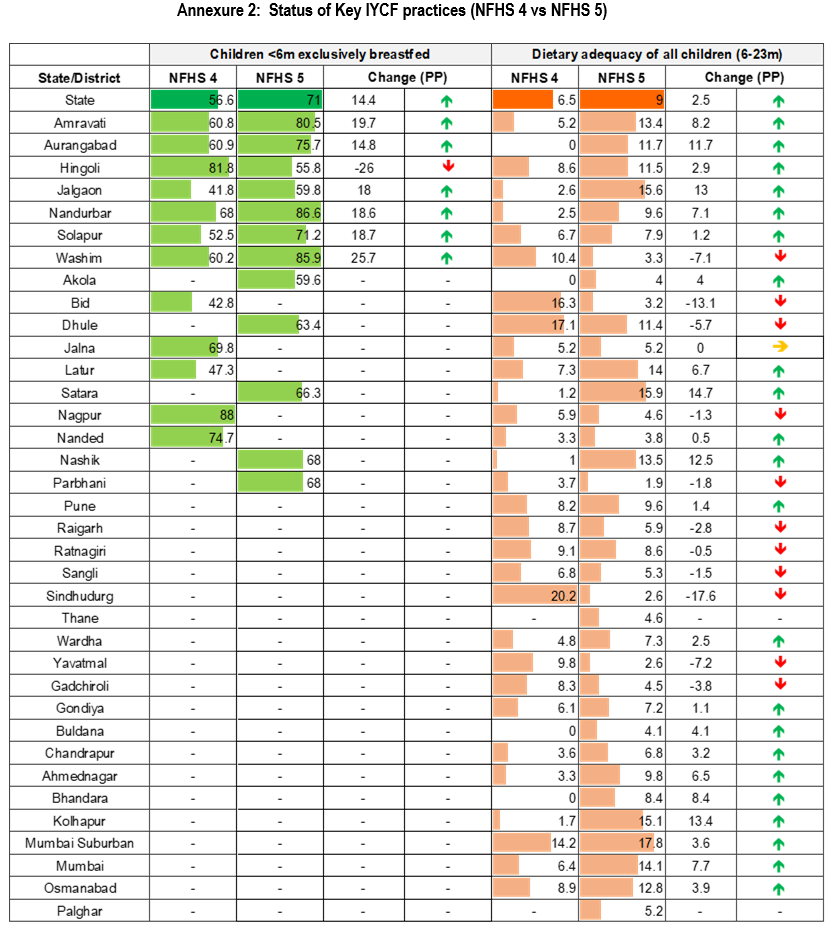
Inadequate dietary intake and child morbidity are major immediate factors that contribute to childhood undernutrition.1 Among the five indicators presented (Figure 2, Annexure 1 & 2), most districts reported progress in two indicators– increase in dietary adequacy for young children as well as reduction in prevalence of women with low BMI (BMI <18.5 kg/m2). Early initiation of breastfeeding was an area of concern where most districts reported a reduction in rates however the steepest decline was observed in Satara (-20.1pp) and Jalgaon (-15.7pp) districts. Hingoli was the only district among the seven districts, which reported exclusive breastfeeding rates that saw a steep decline in its rates.
Half of the 34 districts reported decline in the incidence of diarrhoea since NFHS 5. However, three districts reported a significant increase — Washim (12.2pp), Nashik (11pp) and Jalna (10.8pp). While most districts reported an increase in their prevalence of acute respiratory infection (ARI) compared to NFHS 4, the increase was low in most cases (0.1 to 6.1 pp).
Underlying Factors
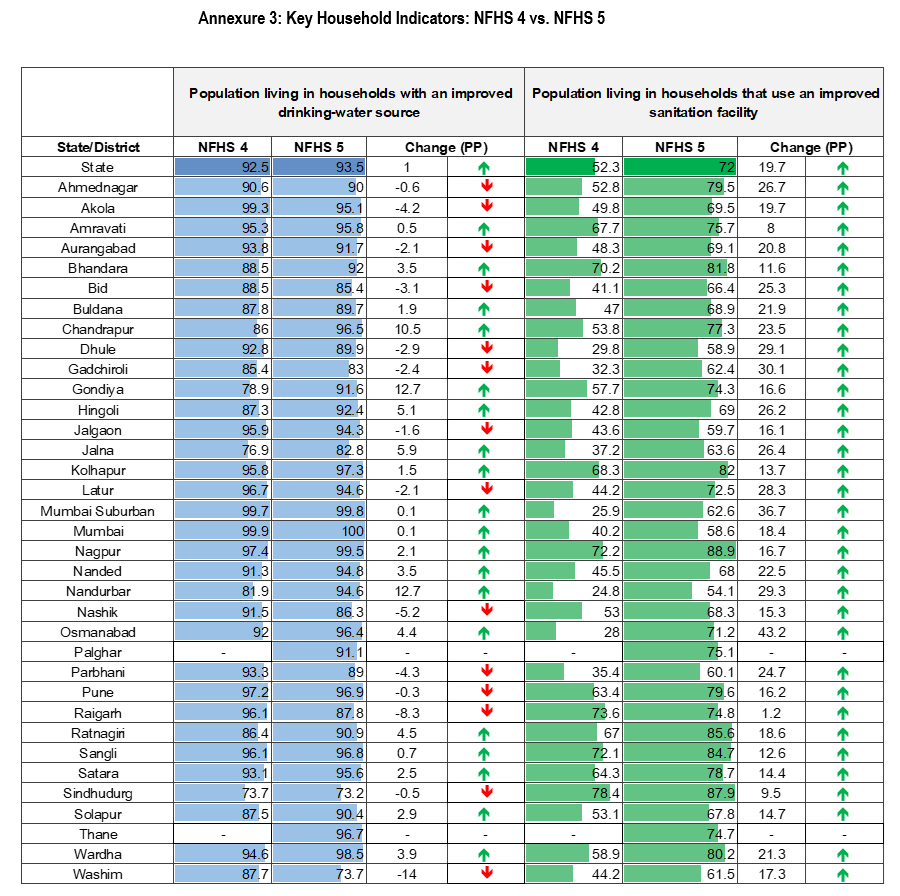
A child’s dietary intake and exposure to disease are affected by underlying public health factors, in terms of access to sanitation and clean source of drinking water, along with extent of accessibility to adequate health care. The latest survey reveals notable progress on public health indicators (Annexure 3). 20 of the 34 districts reported an increase in households with improved drinking water source. Nandurbar and Gondiya reported the best progress between the survey rounds. It is evident that districts like Washim and Sindhudurg still need to improve coverage on this indicator.
While all 34 districts reported increase in use of improved sanitation facilities, more focus must be given to Nandurbar, Dhule and Jalgaon to improve their coverage, where about 40% of surveyed households still do not have access to better sanitation facilities
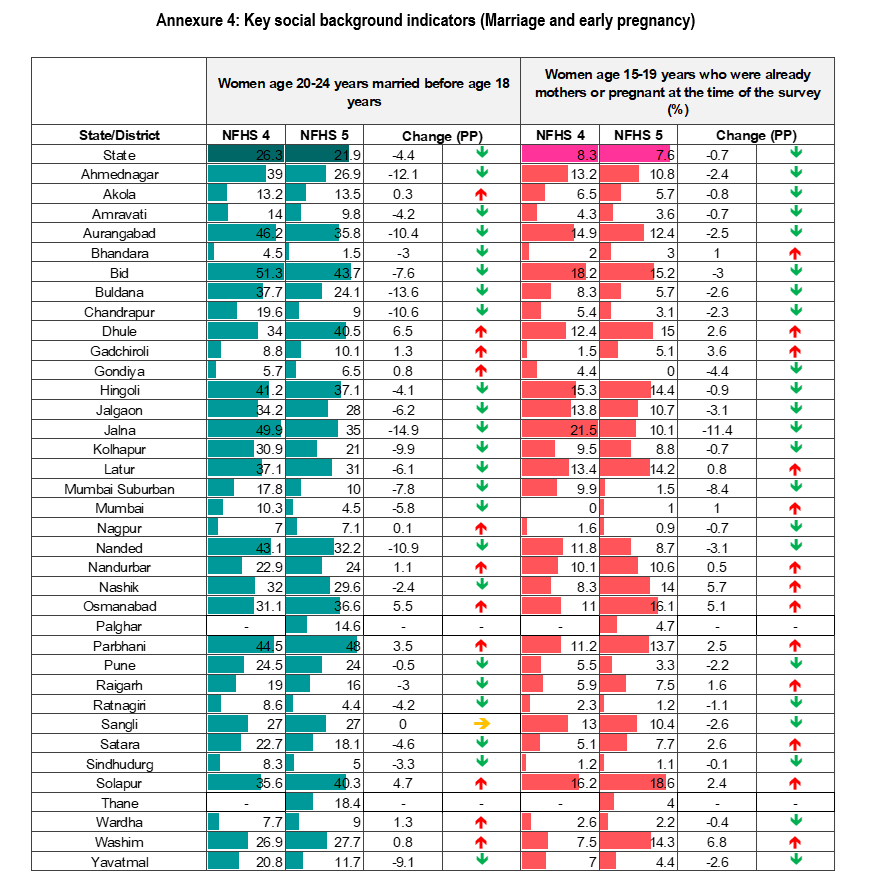
Annexure 4 and Figure 3 present data on key social indicators which indicate moderate progress for most districts between NFHS 4 and NFHS 5. According to data, 22 of 34 districts reported an improvement in figures of early marriage, whereas 21 of 34 districts reported improvement in early pregnancy. While the increase was modest for most, at least six districts reported decrease of 10 percentage points in rates of early marriage. Jalna district reported the best improvement in both early marriage and early pregnancy. Bhandara (1.5%) reported the lowest rates of early marriage whereas Parbhani (48%) reported the highest rates of early marriage. On the indicator of early pregnancy, Gondiya reported the lowest (0%) levels whereas Solapur (18.6%) had reported the highest incidence in the latest round.
Almost all districts reported higher figures in NFHS 5 for 10 years or more schooling of women compared to NFHS 4 (32 of 34 districts). Mumbai Surburban and Mumbai city districts reported the highest increase. Mumbai city leads on this indicator (Figure 3).
Intervention coverage
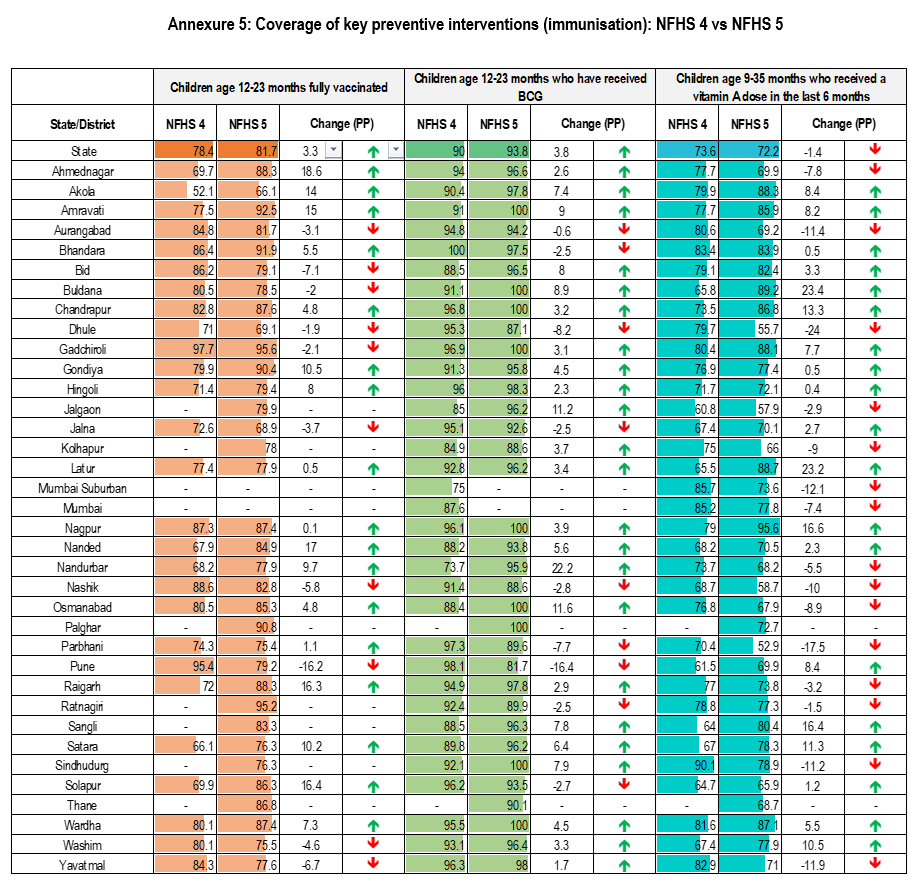
The following section presents data of certain select critical preventive and maternal care interventions that impact health outcomes (Annexure 5, 6a-c). Among vaccination indicators presented, most districts showed progress in BCG coverage, followed by full vaccination among children aged 12-23m but many districts lagged behind in terms of vitamin A dose coverage for 9-35 m children. Aurangabad and Dhule have reported decrease in all 3 parameters of immunization presented below, which is a worrisome trend. 10 districts improved their figures in all 3 parameters and among them Amaravati and Akola reported the highest improvements in their figures since NFHS 4 (Annexure 5).
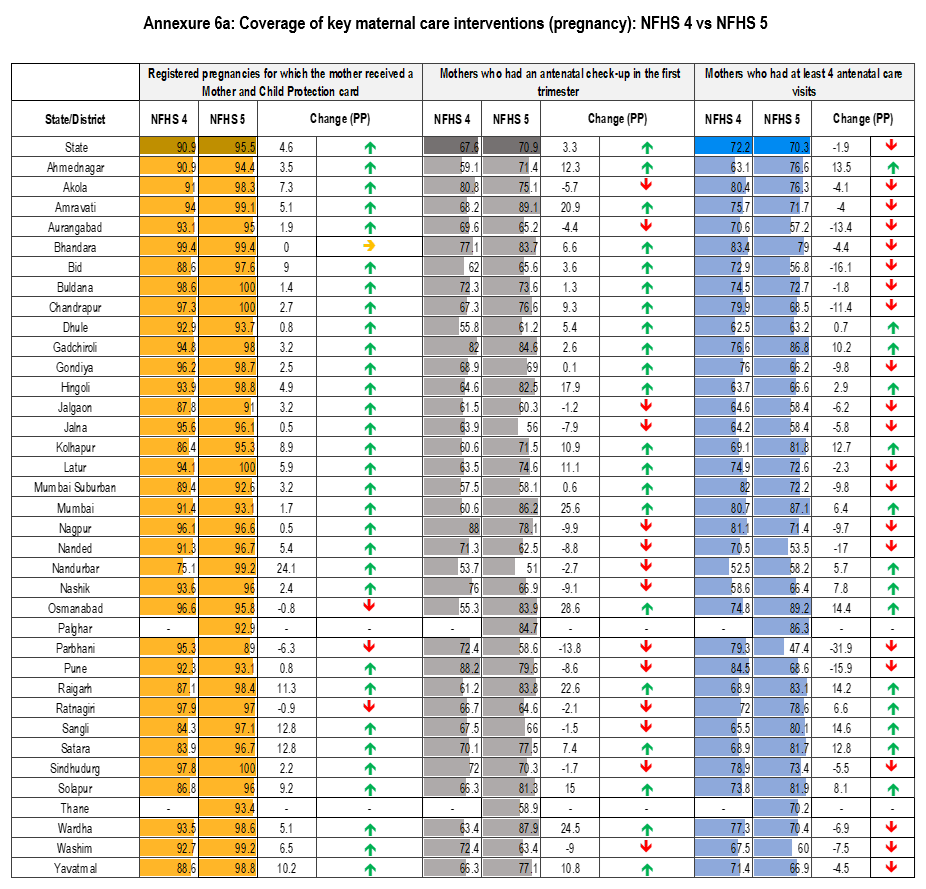
Almost all districts have shown improvement in the eight key maternal care indicators. As observed in Annexure 6a, 30 of 34 districts have reported a higher coverage of registered pregnant women receiving an Mother and Child Protection (MCP) card compared to NFHS 4. While most districts had high rates of registered mothers who received MCP card, there are still gaps in coverage of antenatal checkup (ANC) in the first trimester as well as 4 or more ANC visits. Four districts reported high improvements (>10 percentage points) in both these indicators — Osmanabad, Raigarh, Ahmednagar and Kolhapur.
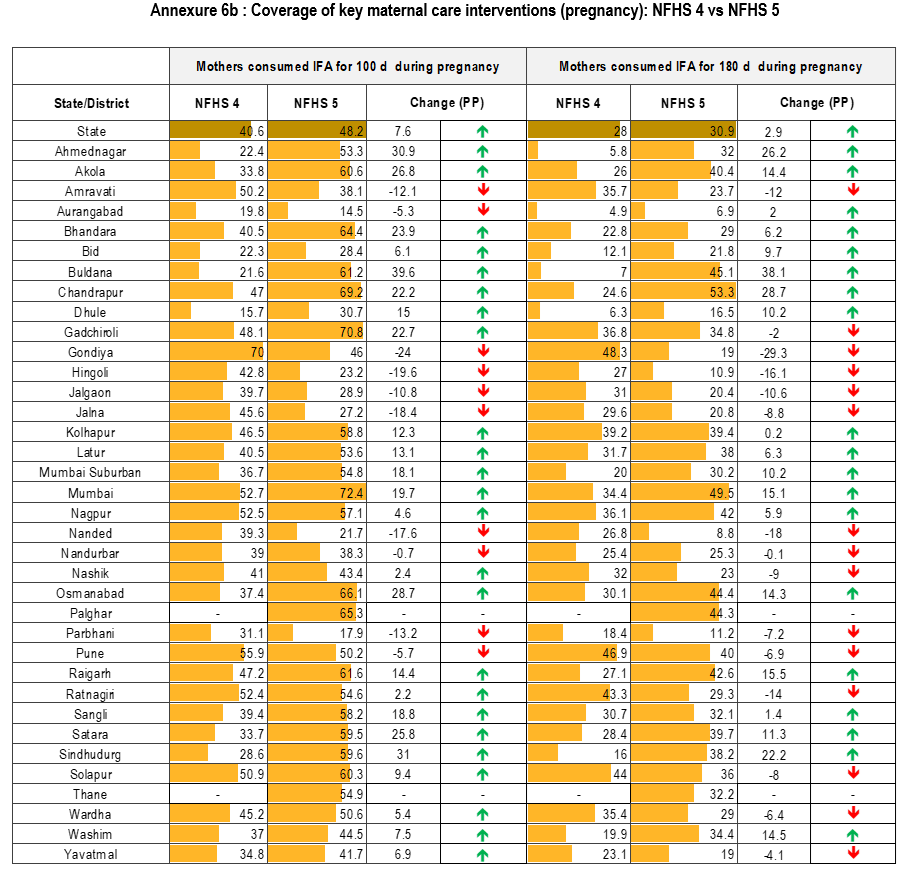
A significant gap can be observed in rates of consumption of iron and folic acid (IFA) tablets for 100 compared to 180 days. 10 of 34 districts reported decrease in consumption of IFA for 100 days whereas 15 of 34 districts reported decrease in IFA consumption for 180 days between the survey periods. Gondiya reported the steepest decline in IFA consumption for both 100 days and 180 days between the two rounds. According to NFHS 5, Aurangabad has the lowest rates of IFA consumption for both 100 and 180 days (Annexure 6b).
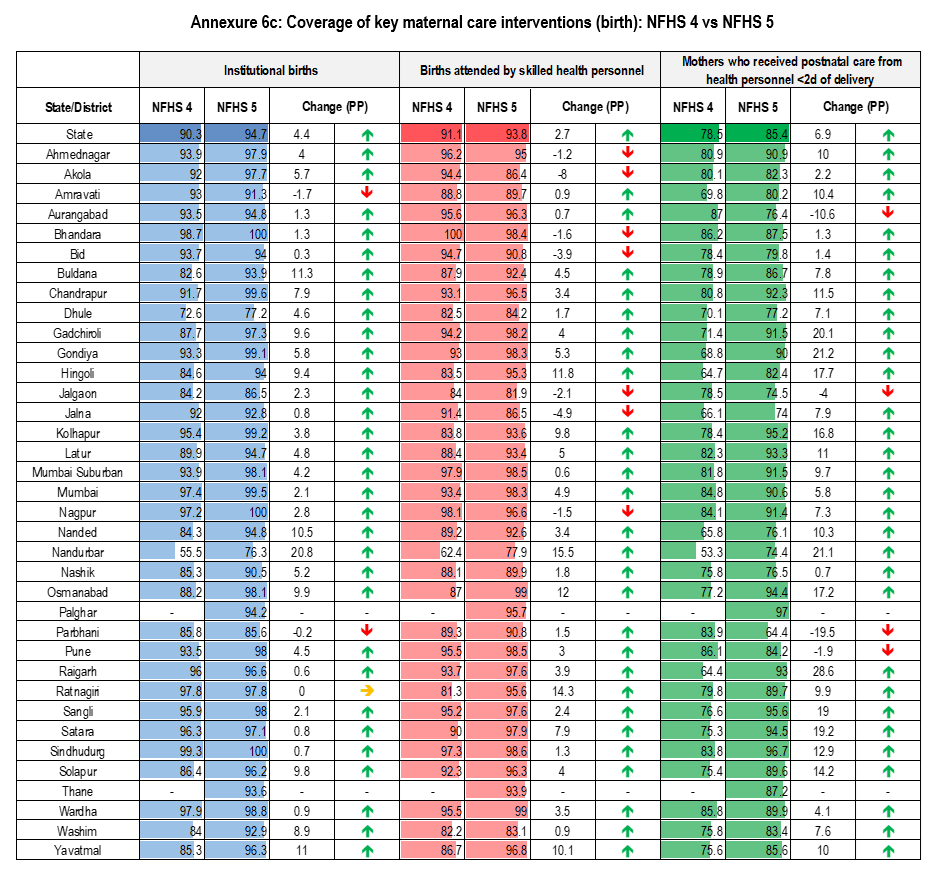
Most districts of Maharashtra reported an increase on rates of institutional births (31 of 34 districts) and postnatal care (30 of 34 districts). As per NFHS 5, two districts—Bhandara and Sindhudurg reported 100% rates of institutional births. Wardha and Osmanabad reported the highest rates of births attended by skilled health personnel (99%). Among districts, Nandurbar had the lowest rates of both institutional births (76.3%) and births attended by skilled health personnel (77.9%) as per NFHS 5. However with 64.4% coverage, it was Parbhani district that reported the lowest rate of maternal postnatal care (Annexure 6c) .
Discussion
The data of NFHS 5 reveals some worrying trends. Child anthropometry, especially rates of severe wasting seems to be worsening in several districts. Also for most districts that have reported reduction in their underweight and stunting prevalence, the reductions have been moderate. Most of the aspirational districts of Maharashtra have performed relatively better in child nutritional status indicators2. However, the most improvement, between the two survey rounds, was reported by districts of Yavatmal, Gadchiroli and Nandurbar. On the other hand, both adult (women of reproductive age) and child anaemia have increased in most districts. This spike in child and women anemia appears to be an all-India phenomenon. According to NFHS 5 data, 18 of 22 states reported increase in its child anemia rates whereas 13 of 22 states reported increased rates of anemia among pregnant women3. This warrants more focused interventions in districts which have witnessed steepest increase.
Immediate determinants presented a mixed picture. One promising trend was the improvement in maternal nutritional status across most districts. Data on IYCF presented mixed patterns. While most districts (for which data was released) reported increases in rates of exclusive breastfeeding, most districts reported decreases in rates of early initiation of breastfeeding. Also despite that many districts reported improvement, the low rates of dietary adequacy continues to be a major area of concern for all districts. Districts like Bhandara and Buldana reported the highest overall increases in IYCF indicators. In terms of other factors like poor maternal nutritional status and morbidity reduction, Sangli, Sindhudurg and Wardha reported the best reductions.
Among underlying factors, the most significant and consistent improvements were seen in terms of sanitation and improved drinking water facilities. Despite this, many districts have reported increase in rates of diarrhoea. Among the three social indicators, consistent improvement across districts was noted in terms of women’s education. However the improvements especially for early motherhood were mostly marginal. Jalna and Buldana reported most improvement in early marriage and pregnancy indicator, whereas Mumbai Surburban, Osmanabad and Chandrapur reported the maximum improvement in the drinking water source and sanitation coverage.
Improvements in coverage of key maternal and child care interventions in most districts demonstrates a positive trend. While there have been improvements in many districts between NFHS 4 and NFHS 5, critical gaps remain specifically in areas such as vitamin A dose coverage, consumption of IFA for 100/180 days and completion of 4 or more ANC visits. This also needs effective program implementation that also addresses demand side (household-behavioural) factors. Poshan Abhiyan also acknowledges the need to support mothers to improve nutrition behaviours in their recent guidelines.4 Among districts, Satara has performed well overall in terms of intervention indicators however Amravati reported the highest improvement for child immunization, Ahmednagar and Osmanabad for maternal care (pregnancy) and Nandurbar reported the highest increase in coverage of maternal care (birth) indicators.
The recent data provides some insight into progress on key indicators. However a more detailed analysis needs to be done once raw data is available by looking at other parameters i.e correlates of child malnutrition.
References
- UNICEF. (2015). UNICEF’s approach to scaling up nutrition for mothers and their children. Discussion paper. Programme Division. UNICEF, New York
- Niti Aayog (2018). Transformation of Aspirational Districts.
- International Institute for Population Sciences. (2020). Factsheets. Key Indicators 22 States/UTs from Phase 1. National Family Health Survey (NFHS 5).
- Government of India. (ND). Jan Andolan Guidelines: Poshan Abhiyan. Ministry of Women & Child Development, Government of India.
- International Institute for Population Sciences. (2020). District Factsheets for key indicators. District Level key findings from NFHS- 5.
PDF version is available here
Contact us
Marian Abraham & Dr. Satish B Agnihotri, Nutrition Discussion Group, CTARA,
IIT Bombay, Powai Mumbai 400076
Share feedback & suggestions: marian.s.abraham@gmail.com